Coder
ODU Computer Science | Coder
Coder is a platform for creating and managing remote development environments. It allows ODU CS students and faculty to provision cloud-based workspaces with ease, ensuring a consistent and powerful development experience.
Getting Started
Follow these steps to create and use a Coder workspace.
1. Sign In
Go to the Coder Web UI and sign in.
VPN Required
The CS VPN is required to access this platform.
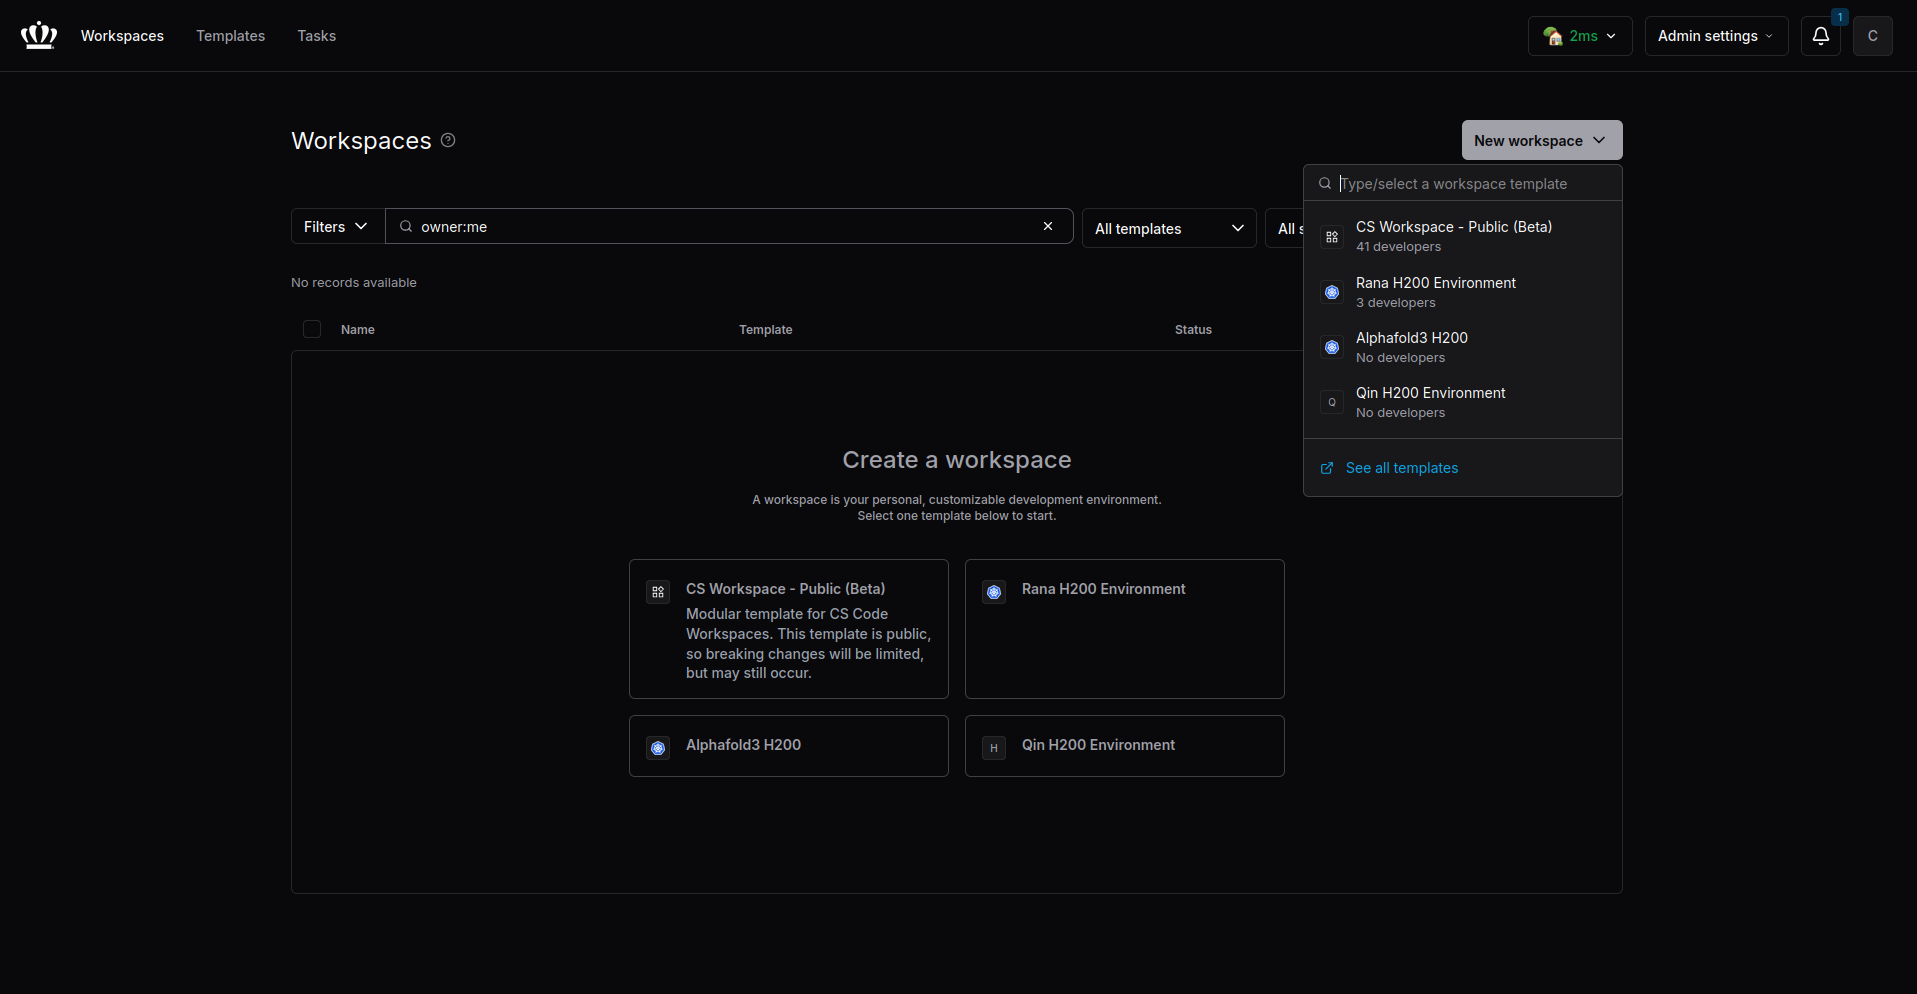
2. Create a New Workspace
Click the New Workspace button in the corner and select an available template.
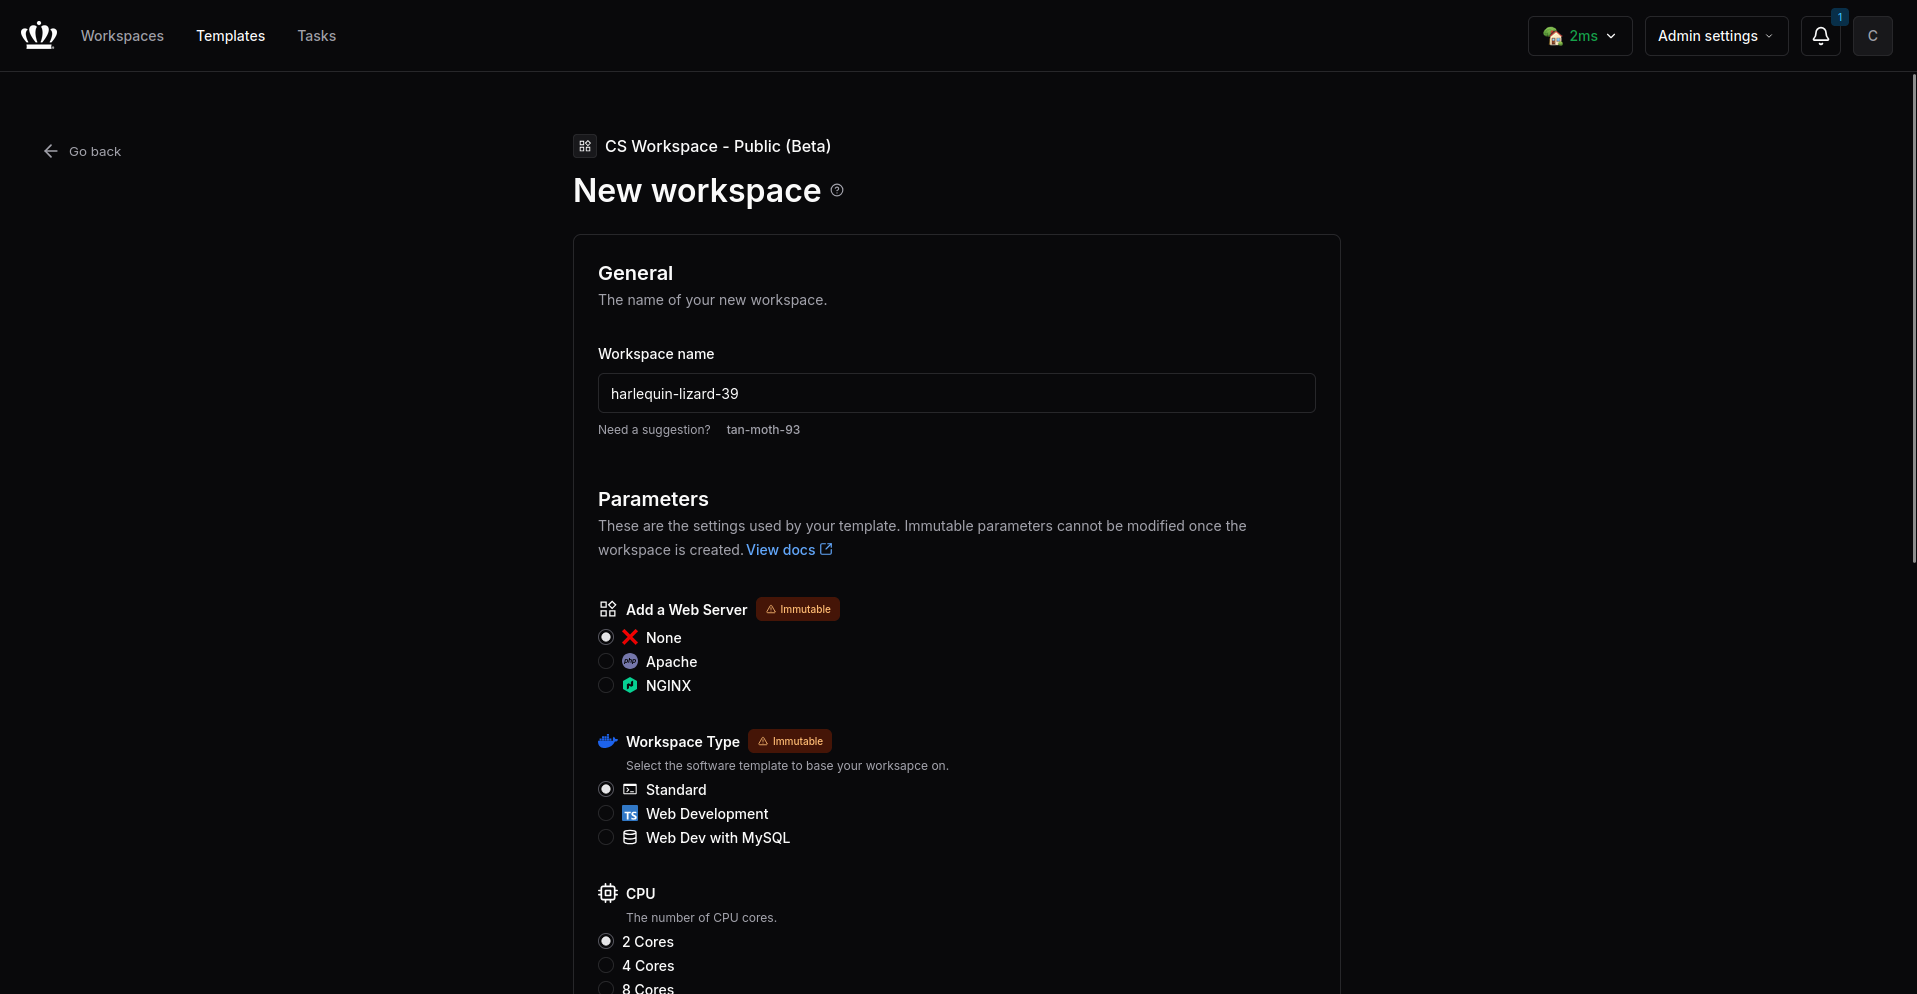
3. Customize Workspace
Customize your workspace parameters as needed.
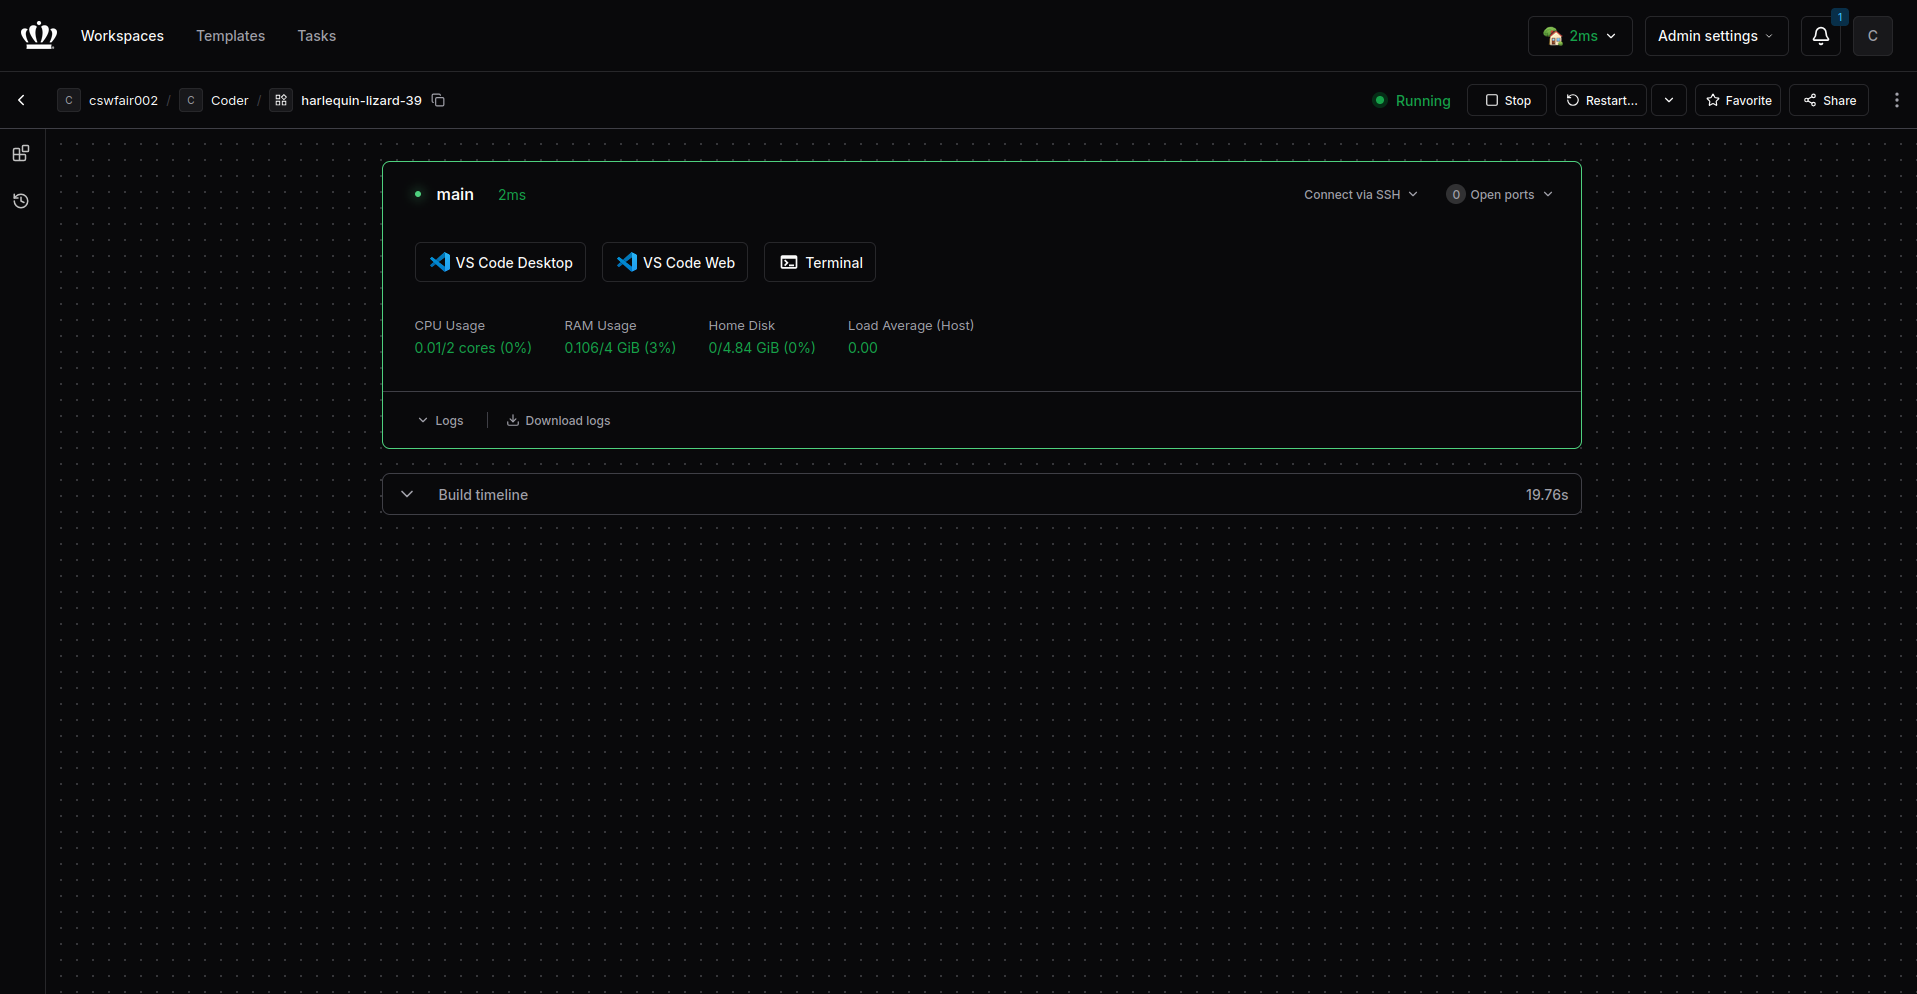
4. Interact with Workspace
Once the workspace is started, click the buttons to interact with your environment.
Managing Workspaces
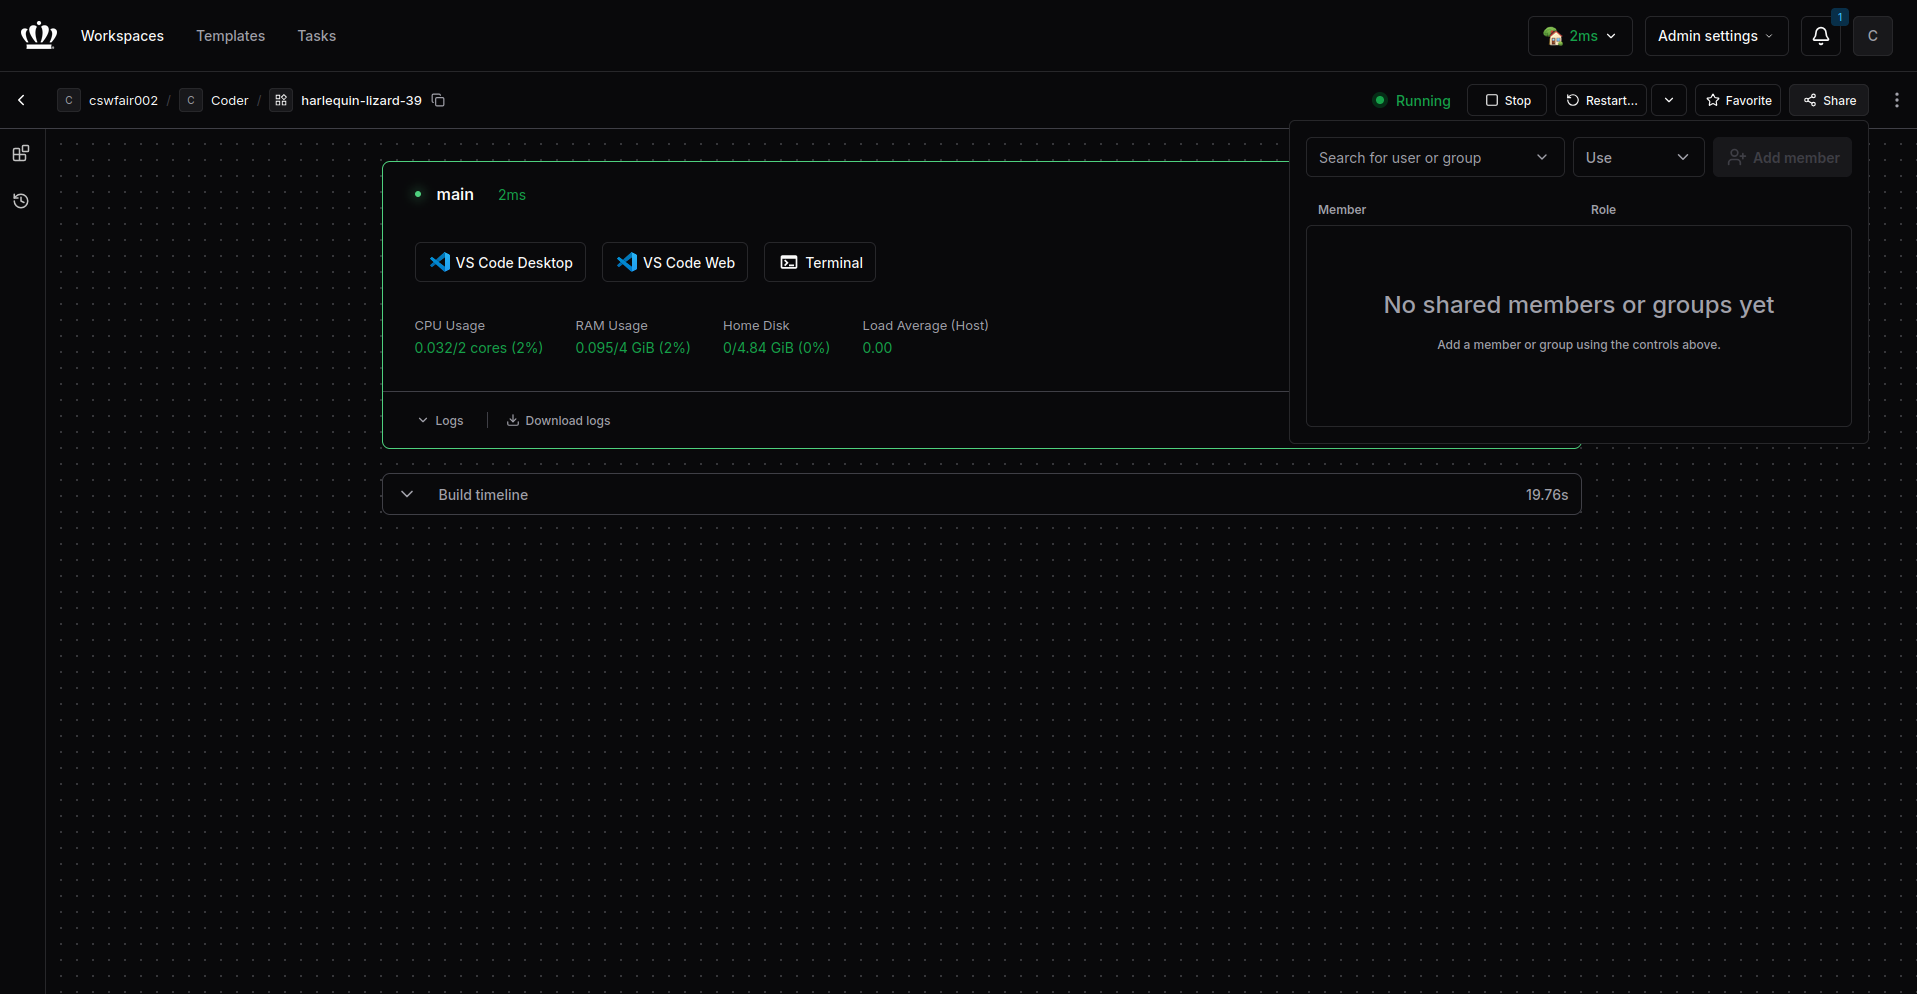
Sharing Workspaces
You can share your workspace with other students.
- On your workspace page, click the Share button.
- Enter a student email or username to grant them access.
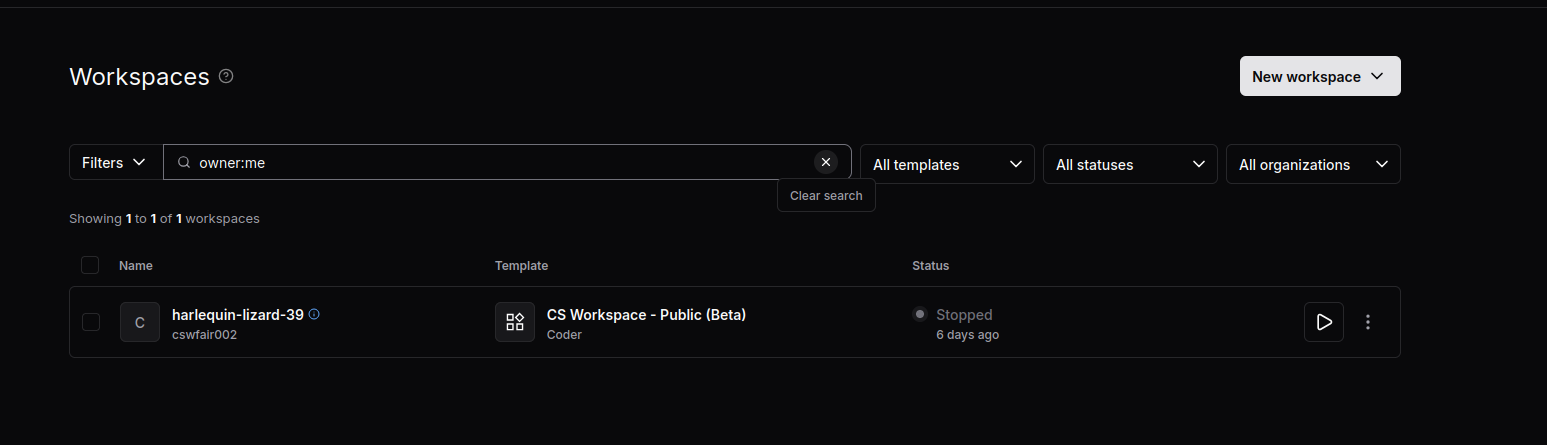
Viewing Shared Workspaces
To view workspaces that have been shared with you, you need to clear the default filter.
- Locate the filter box which defaults to
owner:me. - Click the Clear search button (the "x" icon) as shown in the image.
- This will display all workspaces you have access to, including those shared by others.
GPU Profiling & Monitoring
The CS Department provides a public GPU monitoring dashboard powered by NVIDIA DCGM and Grafana . This dashboard exposes real-time GPU performance metrics — including SM utilization, tensor core activity, memory bandwidth, estimated FLOP/s throughput, and hardware health — across the entire student GPU cluster.
Why This Dashboard Exists — An Alternative to Nsight Compute
Researchers and students working on CUDA optimization have asked for direct access to NVIDIA Nsight Compute (NCU) and Nsight Systems (nsys) on our shared GPU nodes. These tools provide detailed kernel-level profiling but require elevated hardware access (CAP_SYS_ADMIN / admin-mode profiling) that cannot be safely granted on a multi-tenant cluster without exposing other users' GPU memory and processes.
This dashboard provides many of the same high-level performance signals that NCU/nsys report — SM occupancy, compute pipe utilization (FP16/FP32/FP64/Tensor), memory interface activity, and PCIe/NVLink throughput — without requiring any special privileges. While it does not replace kernel-level profiling (individual warp stall analysis, instruction-level metrics), it covers most common metrics.
CS Account Login & VPN Required
While we do offer a public version of the GPU dashboard that is available without logging here , the above dashboard is much more useful as you can narrow down metrics to a single GPU on a single node if you'd like. Grafana does not allow public dashboards to use template variables, which is why you must sign in to use them.
In order to sign,
1) Navigate to grafana.student.cs.odu.edu
2) Click "Sign in with Keycloak"
3) Sign in with your normal CS credentials
4) Once signed in, click "Dashboards" and select "NVIDIA DCGM Exporter — Filterable"
Available GPU Nodes
The following GPU servers are available to students and faculty through Coder workspaces and JupyterLab:
| Node | GPUs | Model | On Grafana? |
|---|---|---|---|
student-infra-g1.cs.odu.edu |
7 | NVIDIA A40 | Yes |
student-infra-g2.cs.odu.edu |
4 + 4 | NVIDIA RTX A6000 / RTX 6000 Ada | No |
student-infra-g3.cs.odu.edu |
4 | NVIDIA H200 | Yes |
student-infra-g4.cs.odu.edu |
8 | NVIDIA A40 | Yes |
student-infra-g5.cs.odu.edu |
8 | NVIDIA RTX A6000 | Yes |
Using the Dashboard
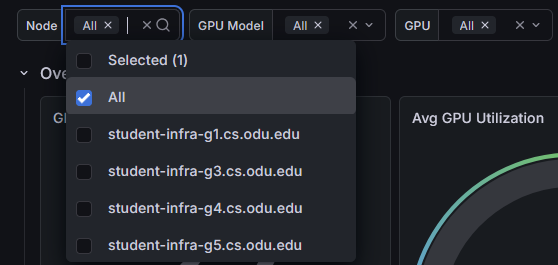
The dashboard has three dropdown selectors at the top that let you filter which GPUs you're looking at. All default to All, showing the entire fleet.
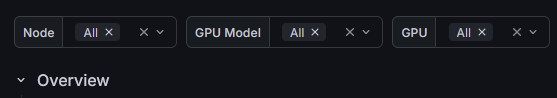
Node Selector
Use the Node dropdown to filter by hostname. Select one or more nodes to focus on a specific server.
For example, selecting student-infra-g3.cs.odu.edu shows only the four H200 GPUs on that node.
GPU Model Selector
Use the GPU Model dropdown to filter by card type (e.g., NVIDIA A40, NVIDIA RTX A6000, NVIDIA H200).
This is useful for comparing performance across different GPU models, or for checking availability of a specific card type.
GPU Selector
Use the GPU dropdown to filter by GPU index (0, 1, 2, ...). The GPU index is relative to each node.
Cross-Node GPU Indices
When Node is set to All, selecting GPU 0 shows GPU 0 on every node. To isolate a single physical GPU, narrow the Node and GPU Model selectors first.
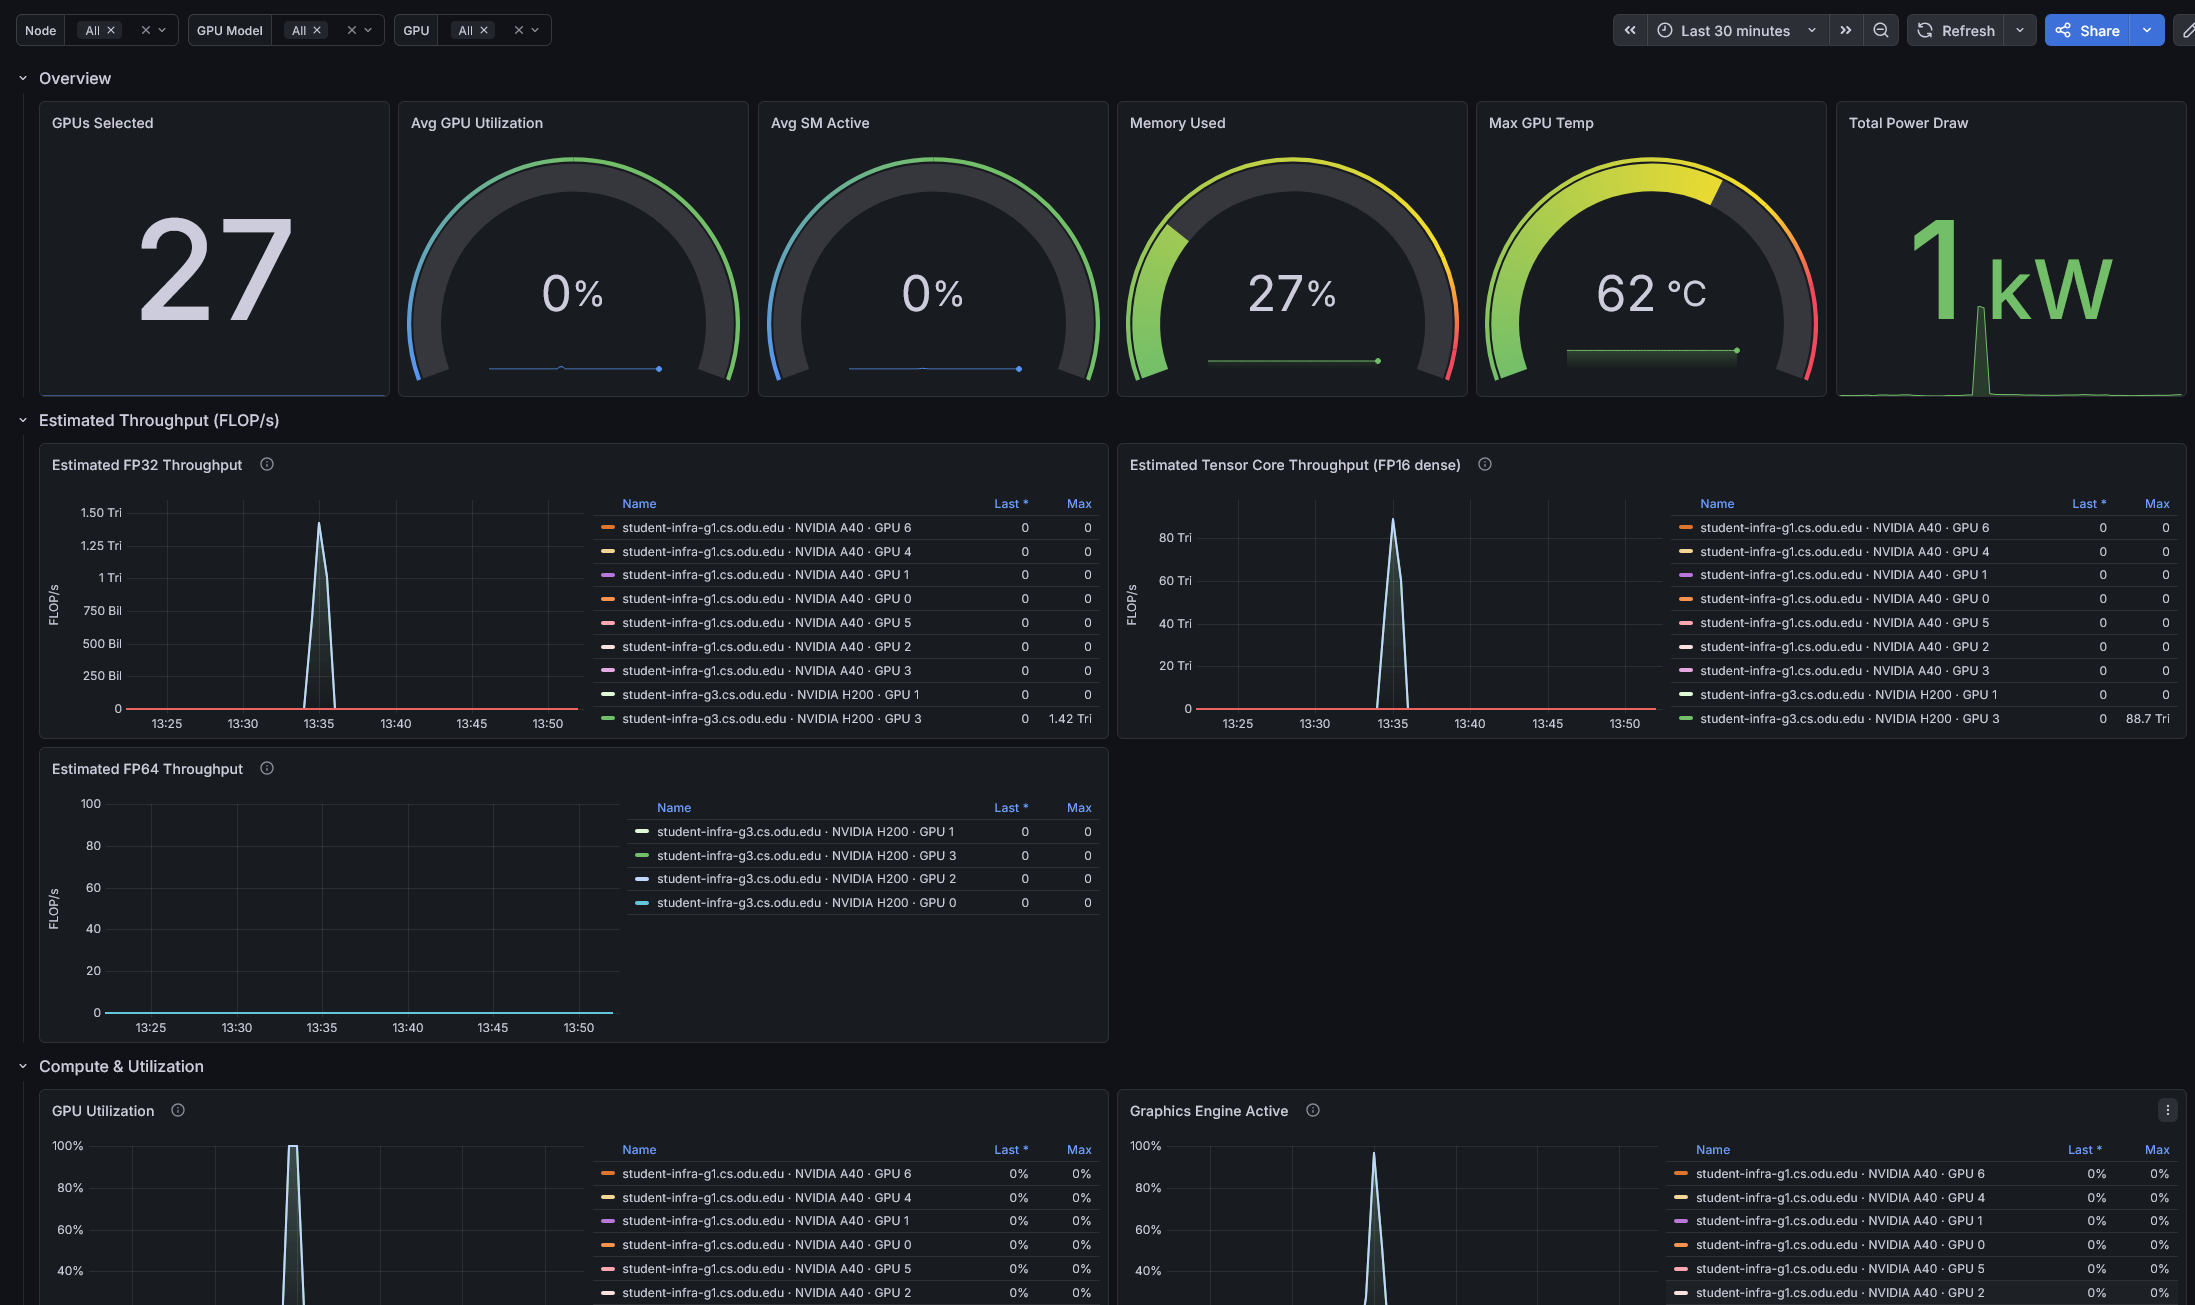
Key Metrics
The dashboard is organized into several sections. Here's what to look for:
Overview
The top row provides at-a-glance summary tiles:
- GPUs Selected — how many GPUs match your current filter selection.
- Avg GPU Utilization — average compute utilization across selected GPUs.
- Memory Used — percentage of GPU memory in use.
- Max GPU Temp — highest temperature reading across selected GPUs.
- Total Power Draw — combined power consumption in watts.
Estimated Throughput (FLOP/s)
These panels estimate the computational throughput of each GPU based on how active its compute pipes are. The values are ceiling estimates — useful for trends and relative load, not exact FLOP counts. Each GPU model is multiplied by its own published peak, so cards of different types are directly comparable.
- Estimated FP32 Throughput — CUDA-core single-precision floating-point throughput.
- Estimated Tensor Core Throughput — FP16-dense tensor throughput. This is where ML training and inference FLOPs show up.
- Estimated FP64 Throughput — double-precision throughput (significant on H200s, minimal on A40/A6000).
Compute & Utilization
Detailed per-GPU time series for:
- GPU Utilization and Graphics Engine Active — overall GPU busy ratio.
- SM Active and SM Occupancy — streaming multiprocessor utilization and warp residency.
- Tensor Core Active — ratio of cycles the tensor (HMMA) pipe is active.
- Memory Bandwidth Utilization and DRAM Active — memory interface activity.
- FP16 / FP32 / FP64 Pipe Active — per-precision compute pipe utilization.
- Encoder / Decoder Utilization — NVENC/NVDEC hardware usage.
Power Management
- Power Usage vs Power Limit — actual draw overlaid with the TDP limit; when they converge, power throttling is occurring.
- P-State — GPU performance state (0 = maximum performance, higher = throttled).
- Clock Throttle Reason — bitmask indicating why the GPU clocks are reduced (power cap, thermal, etc.).
Thermal Details
- GPU Temp vs Thermal Thresholds — current temperature with slowdown and shutdown thresholds overlaid. The gap is your thermal headroom.
- Fan Speed — fan percentage (relevant for A40 and RTX A6000; H200 is passively cooled).
- Memory Temperature — HBM / GDDR temperature vs threshold.
Memory & Clocks
- Framebuffer Used % — GPU memory utilization as a percentage.
- Framebuffer Breakdown — total, used, and free memory per GPU.
- SM and Memory Clock — clock frequencies over time.
Interconnect (PCIe / NVLink)
PCIe and NVLink transmit/receive throughput, NVLink bandwidth per lane, and PCIe replay counters for monitoring data transfer between GPUs and between GPU and host.
NVLink Health
- NVLink Replay Errors — link retransmissions (rising count = link degradation).
- NVLink Recovery Errors — link drop and recovery events.
- NVLink CRC Errors — flit-level and data-level CRC errors (signal integrity).
ECC & Hardware Health
- ECC SBE / DBE (Aggregate) — persistent single-bit and double-bit ECC error counters. DBE (double-bit) errors are uncorrectable — any non-zero value indicates a hardware defect.
- Retired Pages — GPU memory pages retired due to ECC errors and pages pending retirement.
- XID Errors — last XID error code per GPU.
- Row Remap Status — correctable/uncorrectable remapped rows and remap failure flags.
Additional Profiling
- Integer Pipe Active — INT32 pipe utilization (pointer arithmetic, index computation).
- Application SM Clock vs Actual — target clock vs actual; a persistent gap means the GPU is boost-limited.
- PCIe Link State — negotiated PCIe generation and width (detects slot or BIOS misconfigurations).